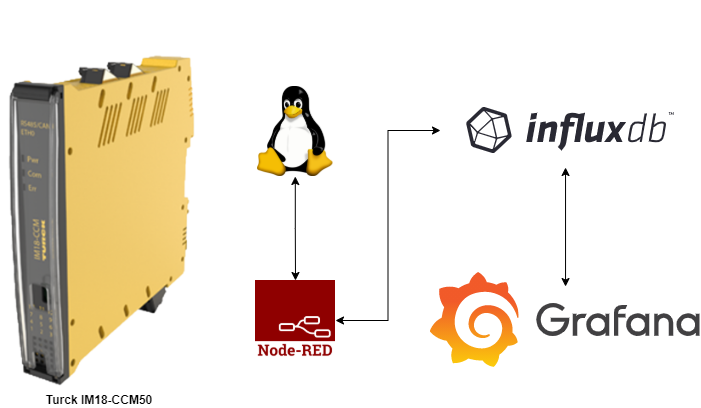
Local dashboard (InfluxDB and Grafana) on the Turck IM18-CCM50
This tutorial explains how to install and setup a local dashboard with InfluxDB and Grafana on the Turck IM18-CCM50. The IM18-CCM50 is a small industrial Linux computer, suitable for placing in control cabinets. More information about the IM18-CCM50 can be found on the Turck website.
InfluxDB is a popular open-source timeseries database that is often used as a method to store time-series data.
Grafana is an open-source monitoring tool that is mainly used for nice looking dashboard. Grafana can interact with a lot of different databases.
Node-RED is a programming tool for wiring together hardware devices, APIs and online services in new and interesting ways. It provides a browser-based editor that makes it easy to wire together flows using the wide range of nodes in the palette that can be deployed to its runtime in a single-click.
First connect to the IM18-CCM50 via SSH. For more information see my previous blog.
Install InfluxDB
The package of InfluxDB that is included with Debian is really outdated (version 1.1.1). To use a more up-to-date version, add the package repository from InfluxDB. The latest version that runs on 32-bit systems is v1.8.10 at the time of writing. Version 2.0 or newer will not run on 32-bit systems, as is explained in a blogpost from InfluxDB.
In the documentation of InfluxDB, instructions are found on how to add the repo. These commands below (slightly changed, because the command lsb_release does not execute on the IM18-CCM50) can be used to add the repository.
sudo wget -qO- https://repos.influxdata.com/influxdb.key | sudo gpg --dearmor | sudo tee /etc/apt/trusted.gpg.d/influxdb.gpg > /dev/null
sudo echo "deb [signed-by=/etc/apt/trusted.gpg.d/influxdb.gpg] https://repos.influxdata.com/debian stretch stable" | sudo tee /etc/apt/sources.list.d/influxdb.list > /dev/null
After the repository is added InfluxDB can be installed:
sudo apt-get update
sudo apt-get install influxdb
To start InxluxDB at boot execute the following command:
sudo systemctl enable influxdb
Reboot the IM18-CCM50 and InfluxDB will start. InfluxDB does not have a user interface, but you can use the commandline (or raw HTTP) to interact with InfluxDB. See also the documentation.
Configuring InfluxDB
Currently InfluxDB is installed without a database (only the internally used database _internal exists). To add a database first connect to InfluxDB using the following command:
sudo influx -precision rfc3339
The output should look something like this:
Connected to http://localhost:8086 version 1.8.10
InfluxDB shell version: 1.8.10
>
Now the Influx Query Language (InfluxQL) can be used. Enter the following command to create a database that is named iot_measurements:
CREATE DATABASE iot_measurements
With the command exit or quit the InfluxDB shell can be exited.
Installing Grafana
Grafana can be installed by downloading the .deb file as indicated on the Grafana download page. Use the instructions for Ubuntu and Debian under the tab ARM and the header ARMv7.
Use the following commands to install Grafana:
sudo apt-get install -y adduser libfontconfig1
sudo wget https://dl.grafana.com/enterprise/release/grafana-enterprise_8.3.3_armhf.deb
sudo dpkg -i grafana-enterprise_8.3.3_armhf.deb
To start Grafana at boot execute the following command:
sudo systemctl enable grafana-server
Reboot the IM18-CCM50 and Grafana will start. Grafana can be accessed by accessing the IP address with port 3000 in the webbrowser. For example: 192.168.2.20:3000. The default user and password are admin and admin. The password can be changed at the first login.
Send data from Node-RED to InfluxDB
In my previous blog the installation and usage of Node-RED is explained. To send data from Node-RED to InfluxDB the Node-RED node node-red-contrib-influxdb can be used. Install this node via the Manage palette function in Node-RED.
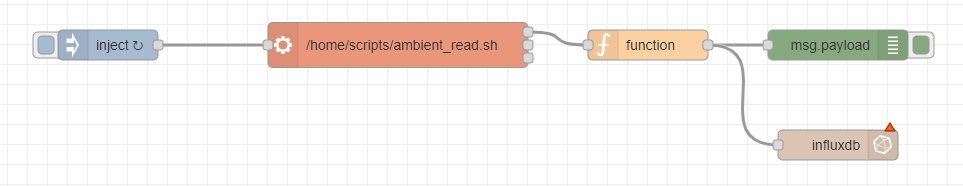
The influxdb out node can be used to send data to InfluxDB. There is a flow available where the ambient_read.sh script that is by default present on the IM18-CCM50 is executed every 30 seconds (this can be changed after importing) and the result is added to the msg object. This data can be used to send to InfluxDB. After adding the influxdb out node the flow looks like this:
The InfluxDB node and server still needs to be configured in Node-RED. Doubleclick the influxdb out node to change the settings.
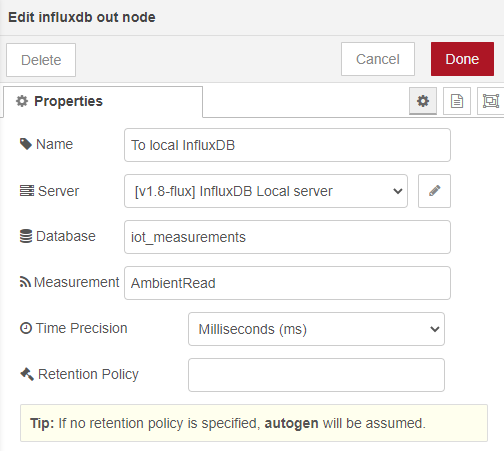
Enter a name, the database name that was made earlier in this tutorial and the measurement name. Then click the small pencil next to the server selection to change the server settings.
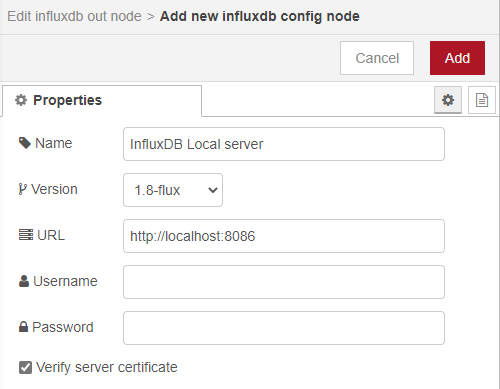
Give the server a name, choose the correct version (1.8-flux) and give in the URL as shown above. It is advised to secure the InfluxDB instance, this is however not covered in this tutorial.
When this flow is deployed every 30 seconds the ambient sensor values will be saved in the InfluxDB database.
Configure the InfluxDB connection in Grafana
Grafana can be accessed by accessing the IP with port 3000 in the webbrowser. For example: 192.168.2.20:3000. The default user and password are admin and admin. The password needs to be changed at the first login. The first view looks like this:
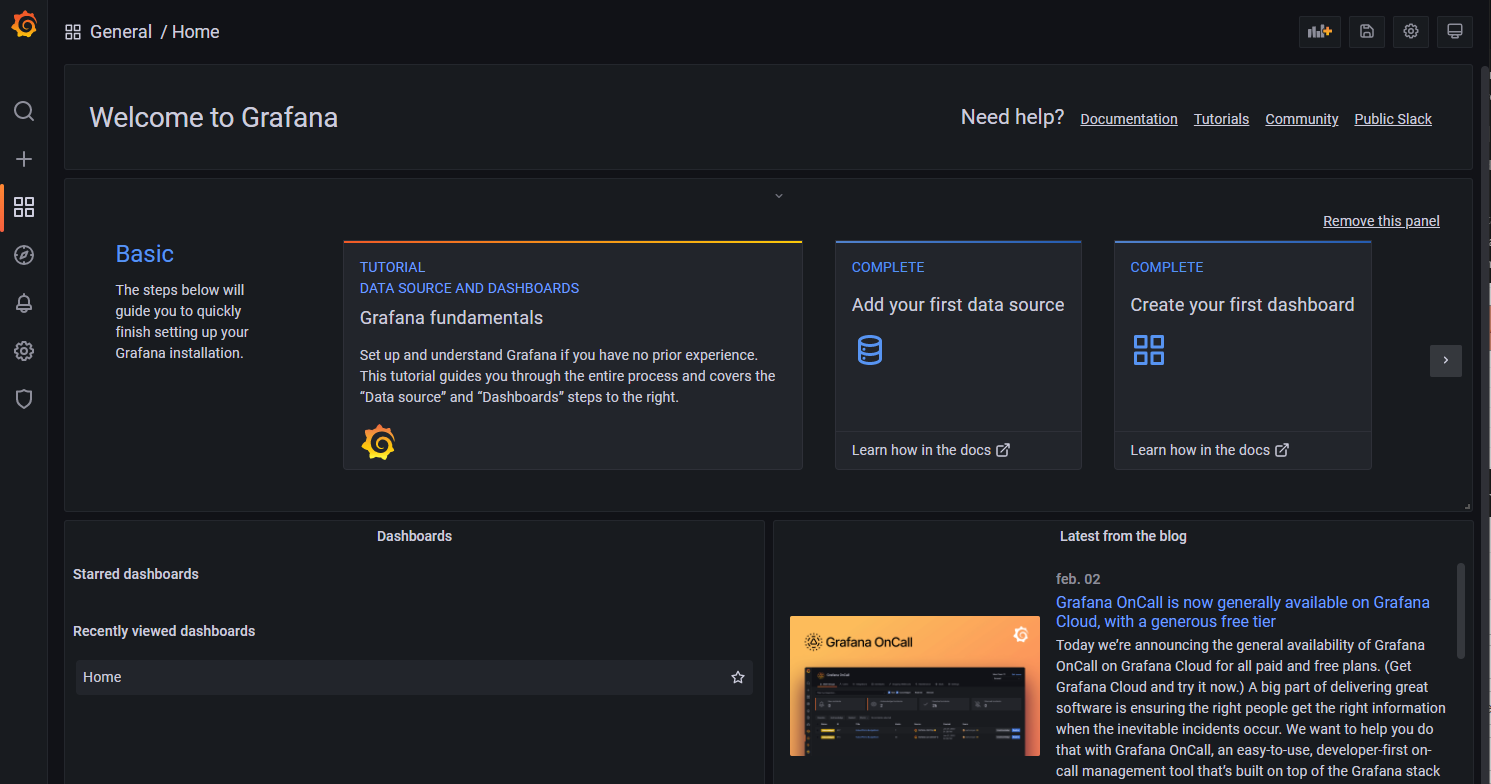
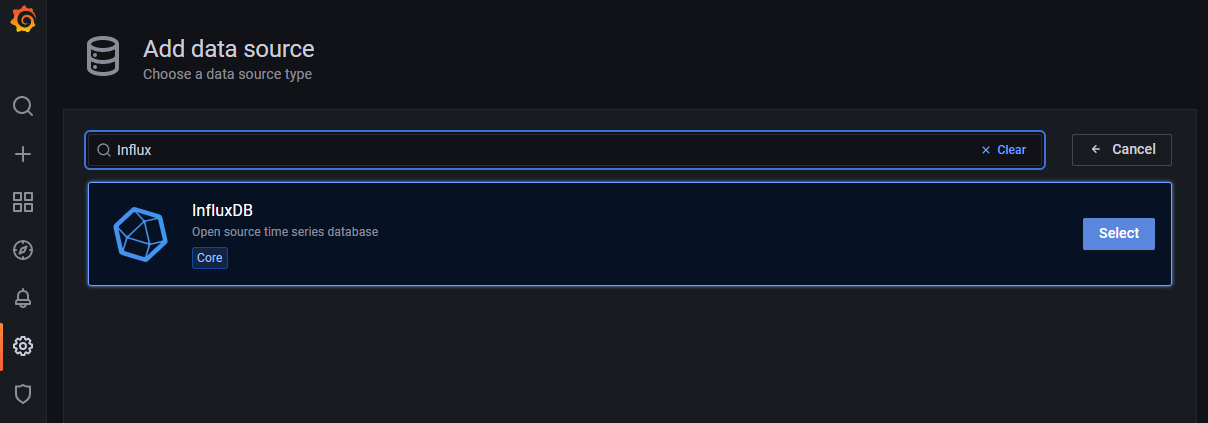
First setup a data source. Click on the Add your first data source tile. Start searching for influx and select InfluxDB.
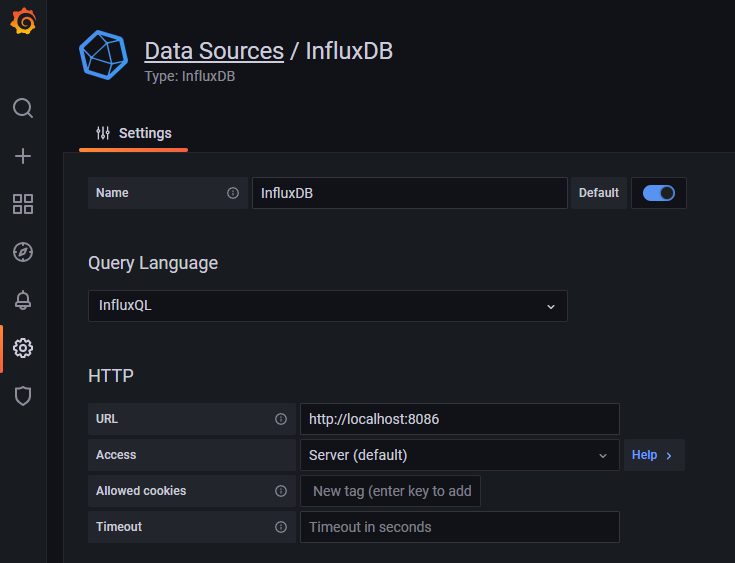
Now give the datasource a name, choose InfluxQL as the query language and fill in the connection settings as shown below.
Scroll down and enter the name of the database created earlier.
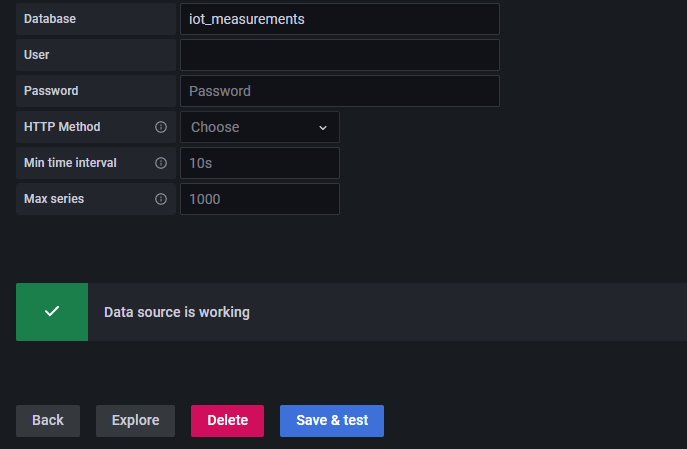
Click Save & test to save the settings and test the connection. The result should show Data source is working.
Visualize the saved values from InfluxDB with Grafana
Go back to the first view and click on Create your first dashboard to create a new dashboard. Then click on Add a new panel. The following screens shows:
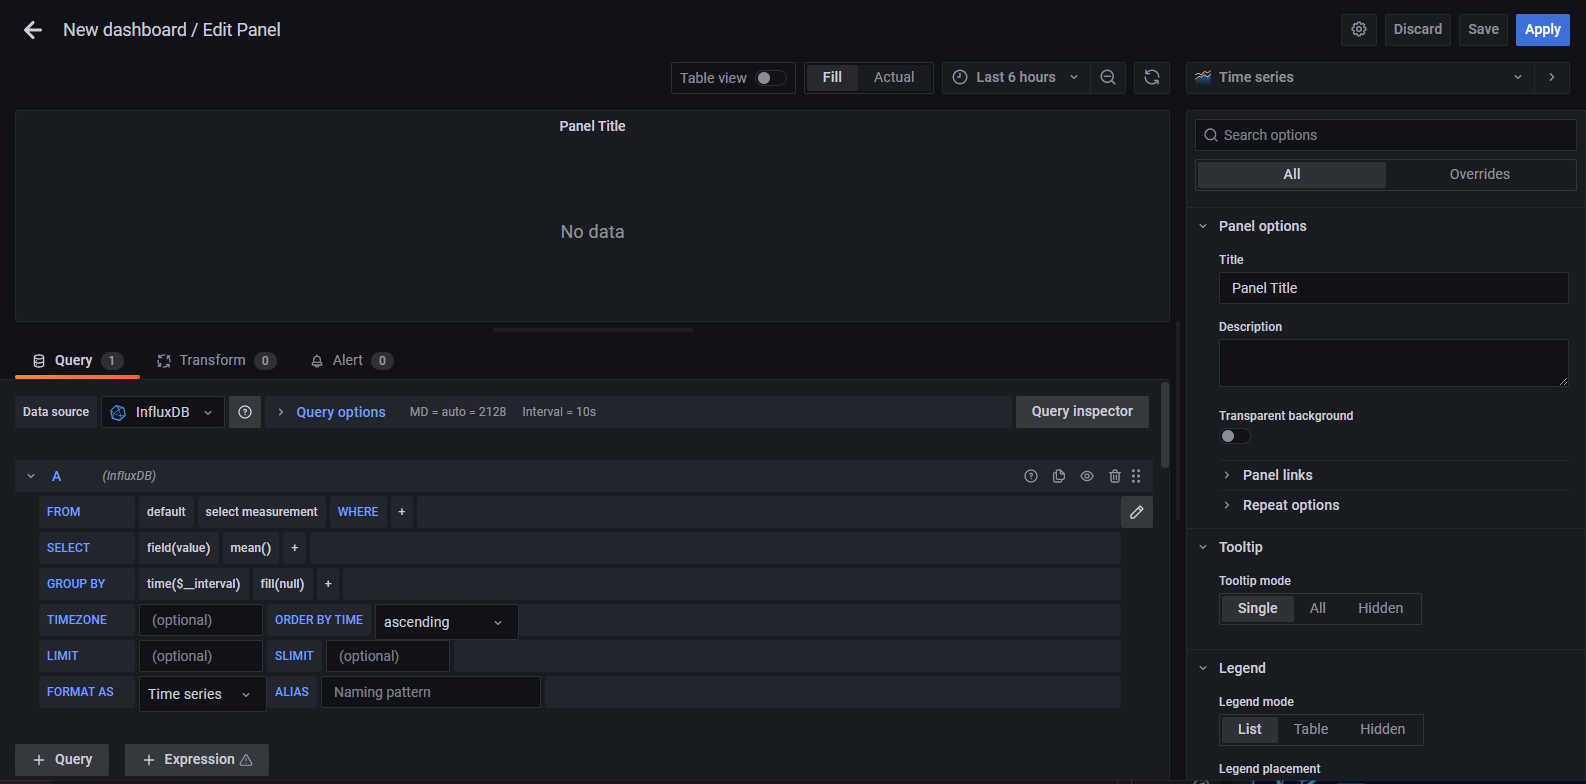
Select the table by clicking select measurement and choose AmbientRead. Click on field(value) to choose the temperature or humidity. Fill in a name in the title. This results in the following:
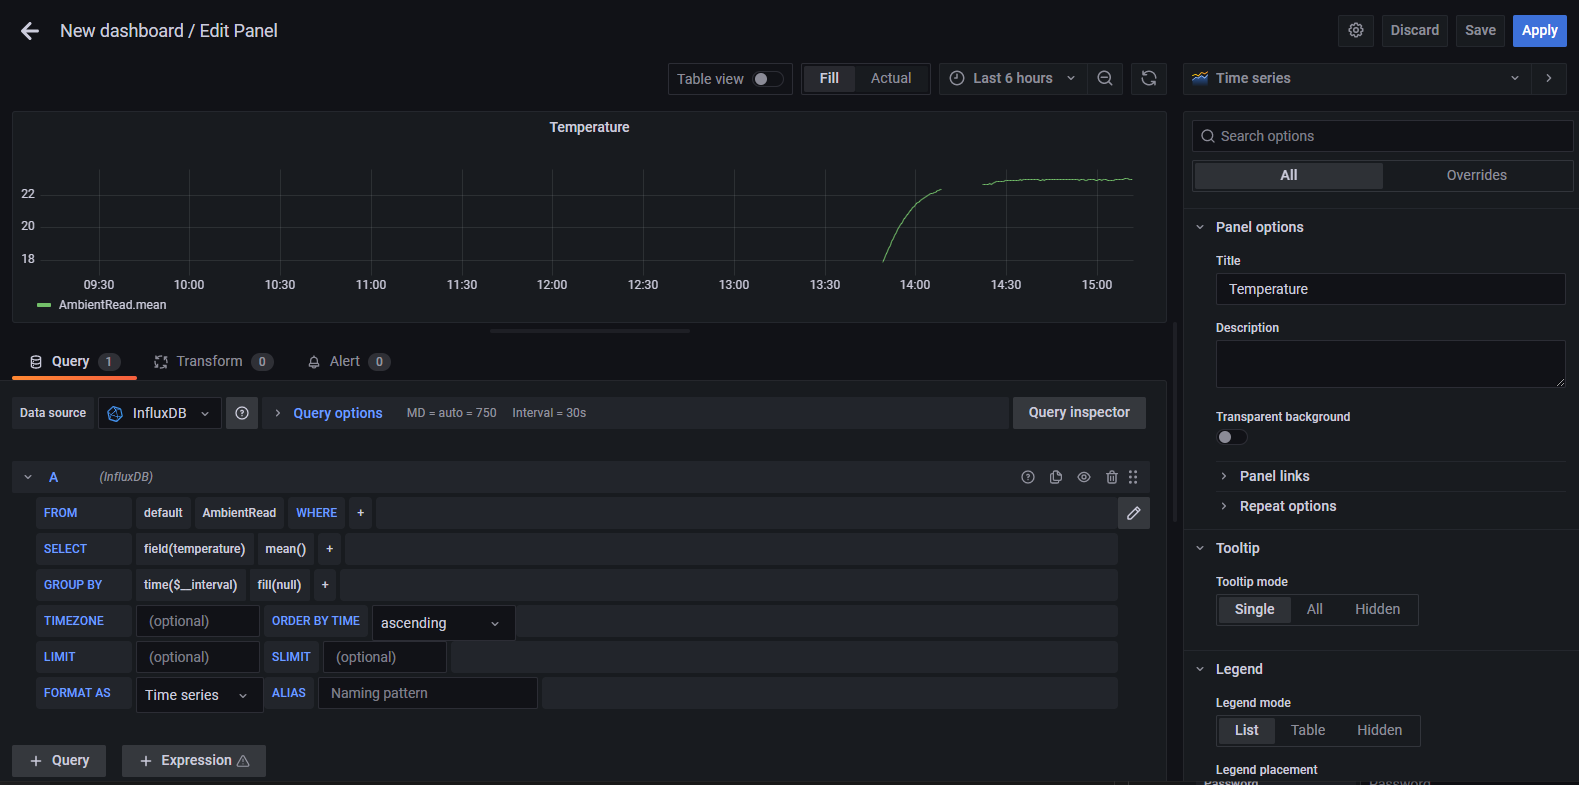
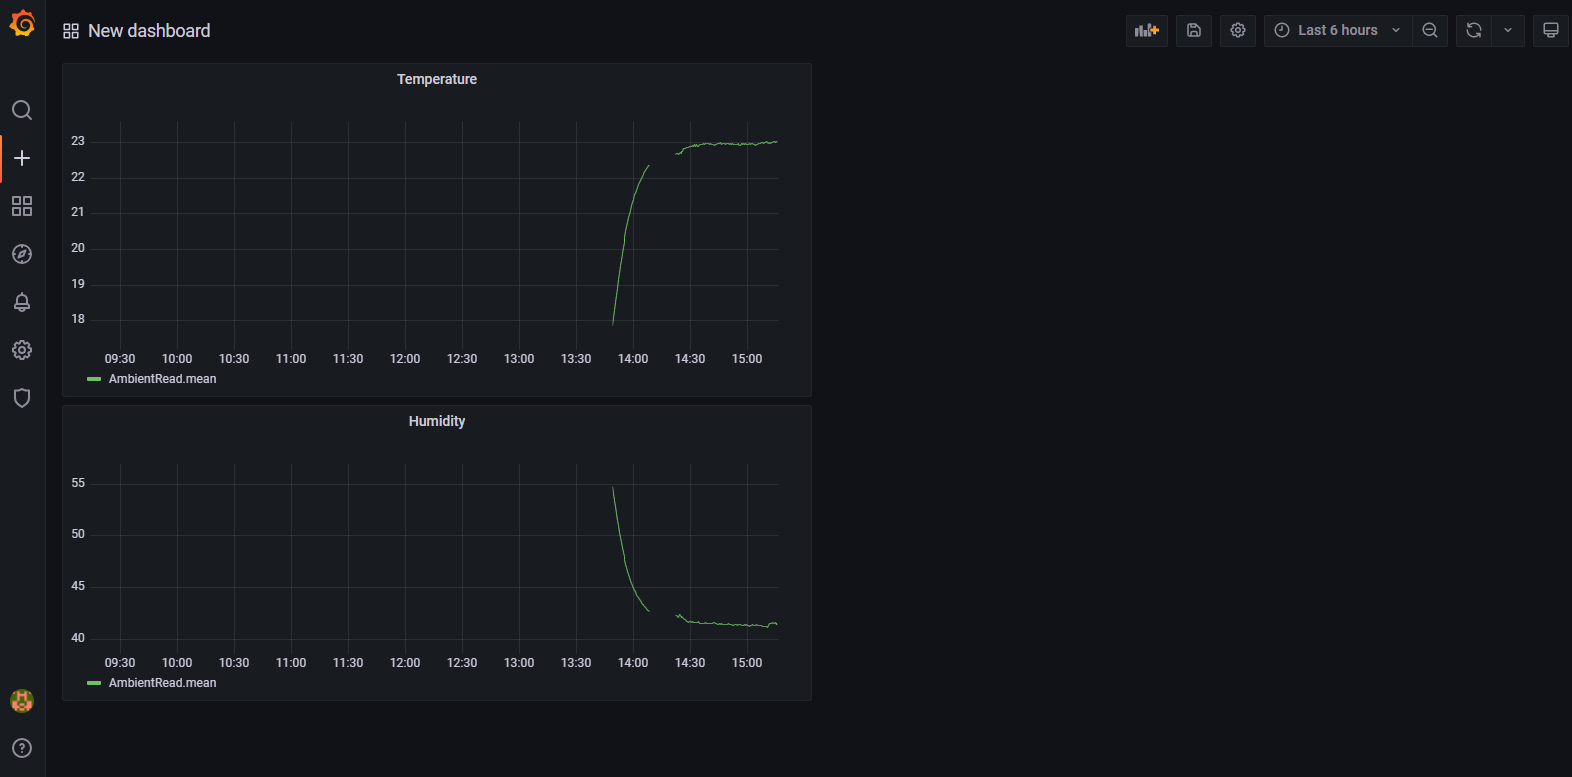
Click save to save and repeat the same process with a new panel to show the humidity as well on the dashboard. This results in a dashboard with 2 graphs:
There is a lot more possible with the panel and query editor. See the Grafana documentation for more information about building panels and advanced query options.
This tutorial shows the installation and usage of InfluxDB and Grafana on the IM18-CCM50. Now it’s possible to collect data with Node-RED, store data in InfluxDB and visualize the data with Grafana.